Automated Temperature Logs
Offload Busy Staff
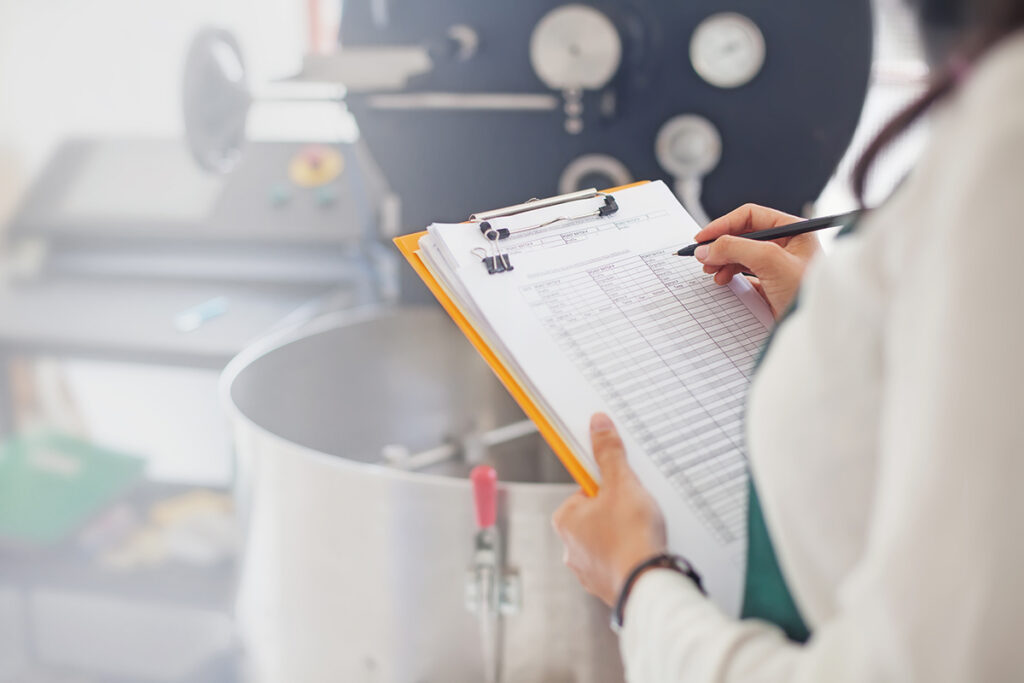
Are you still counting on your people to monitor and record temperatures throughout the day? With the workforce challenges of finding, training, and keeping employees, you are putting your business at risk. Rather than record temperature manually, Swift Sensors gives you a digital log of your daily temperatures automatically. Now your staff can focus on the customers and you can be assured of accurate and complete temperature logs – every time!
Take the Stress Out of Inspections
Users can easily print analytics reports or save them as PDF files. A Print / PDF button is available after a report is generated. This button reformats the report for a standard sheet of paper with a printer-friendly color palette and opens the print dialog. To save the report as a PDF file on the desktop instead of printing it, select “PDF” as the printer destination. The “PDF” option is available on most modern desktop web browsers.
Top Reasons You Should Automate Your Temperature Logging
- Reliable Temperature Logging – The system never takes a day off, doesn’t get sick, and won’t show gaps in the data. And, there’s no possibility of “faking” or “pencil whipping” the data, which seasoned inspectors will quickly spot.
- Complete and Accurate Log Reports – No missed or incorrect data. And you can’t misplace the report. When inspectors show up, you have all of your data complete, neatly formatted, and immediately accessible
- Alerts automatically notify you when the temperature rises – Don’t find out the next day. Get alerted immediately when your cooler or freezer starts showing signs of failure. Early warning systems enable you to save your inventory.
- Busy staff can focus on more important tasks – Your staff shouldn’t be wasting time on tedious, repeatable tasks. By automating, you free them up to focus on the customer.
- Peace of Mind – Not only are you protecting your inventory, you’re also simplifying your next inspection. Don’t sweat it when an inspector shows up at your door.
Automated Temperature Logging Tutorial Videos:
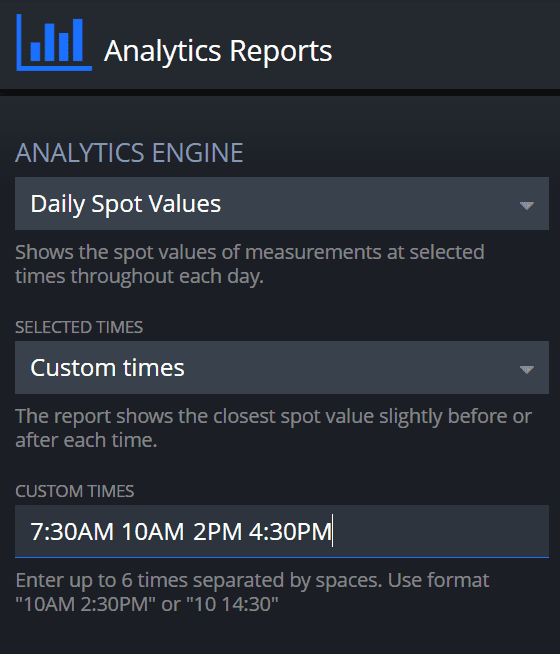
Daily Spot Value
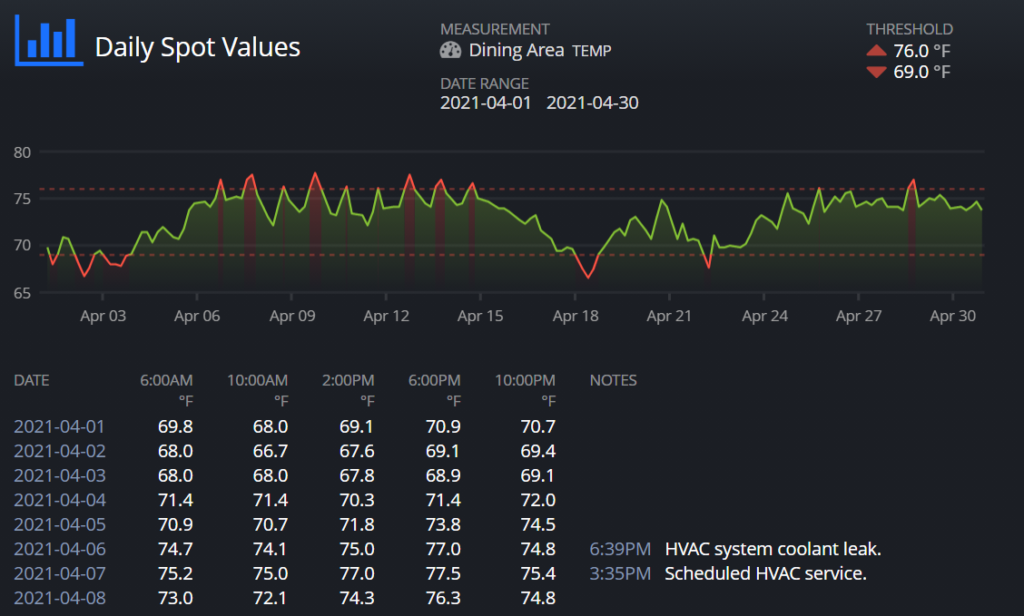
The Daily Spot Values report was inspired by temperature logs used to record temperatures for coolers and freezers that were manually collected at specific times each day. These logs are used to document compliance with Food Safety Management (HACCP) best practices. With Swift Sensors, temperature collection is fully automated, and the Daily Spot Values report can produce weekly or monthly temperature logs for up to 6 custom times during each day. The report interface offers options for some common times of the day, but you can also select “Custom times” and enter your own.
The Daily Extremes report is similar to the Daily Spot Values report, but instead of showing spot values during times of the day, it calculates the daily minimum, average, and maximum values. The Daily Extremes report is optimized for a monthly reporting cycle, with each page focused on one measurement, but a custom date range is fully supported. Please note that while these reports are ideal for temperature data reporting, they can just as easily be used with other measurements including humidity, vibration, and electric current.
Both reports include notes that were entered during each day. This is very useful for customers who use the notes feature to document root cause and action taken to remedy a problem.
As with all analytics reports, you can print these reports or save them as a PDF file by choosing PDF as your printer destination in the print dialog box. The name of the PDF file will now default to the analytics report name followed by the date range.
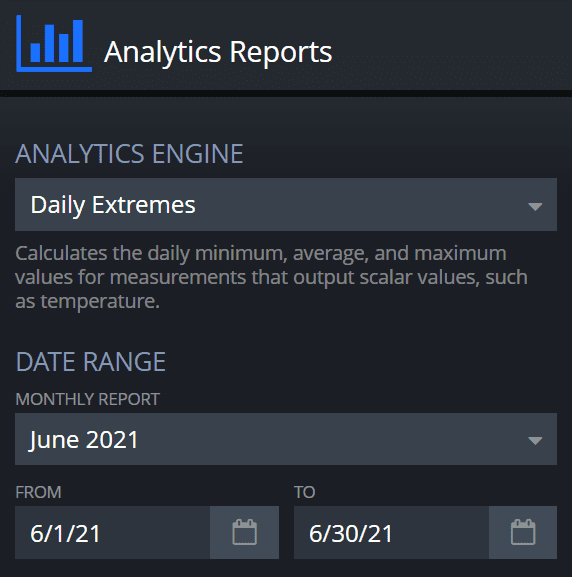
Date range selection has also been enhanced with a Monthly Report dropdown, where you can select from the twelve most recent completed months. As before, you can always select a custom date range which now defaults to starting from the first day of the current month to the current day.
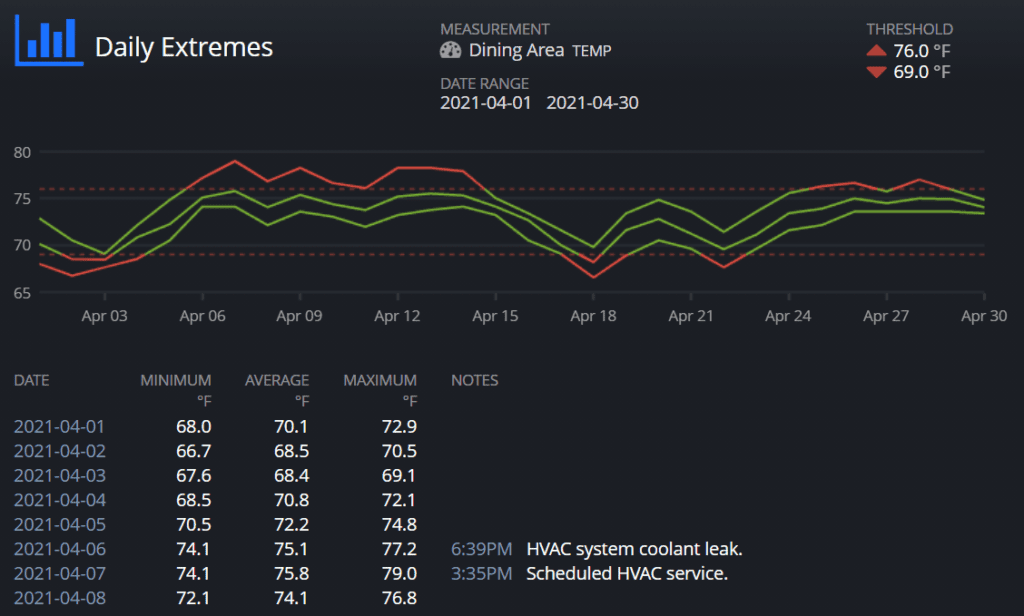
Daily Extremes
This report calculates the daily minimum, average, and maximum values for measurements that output scalar values, such as temperature. The Daily Extremes report is optimized for a monthly reporting cycle, with each page focused on one measurement, but a custom date range is fully supported.
Each page features the following information:
A graph with three lines plotting the daily extreme values in the selected date range. The minimum, average, and maximum lines are situated at the bottom, middle, and top of the graph, respectively.
If the measurement has a threshold, the graphed lines are color coded by daily threshold status and all threshold boundaries are also plotted in the graph and shown in the header.
For each day in the date range, a table shows the date, the minimum, average, and maximum values, and notes.
If one or more notes exist for the day, the notes column includes the time each note was taken, the measurement value at that time, and the note itself. Notes are useful to document the root cause and corrective action taken to remedy a problem.
As with all analytics reports, you can print this report or save it to a PDF file by choosing PDF as your printer destination in the print dialog box. The name of the PDF file will now default to the analytics report name followed by the date range.
Date range selection has also been enhanced with a Monthly Report dropdown, where you can select from the twelve most recent completed months. As before, you can always select a custom date range which now defaults to starting from the first day of the current month to the current day.