fbpx

Dashboard Analytics

Measurement Details: Goal Panel

Users of accounts utilizing analytics features with goals can see more information on the measurement details page.  If goals exist, the Goal panel become visible.  This panel allows the user to see and edit the goal for all analytics types compatible with this measurement.

Measurement Details: Shift Schedule Panel

Users of accounts utilizing analytics features can see more information on the measurement details page.  If shift schedules exist, the Shift Schedule panel becomes visible.  This panels allow the user to see and edit the shift schedule for this measurement.

Dashboard Analytics: Time Duration

On the dashboard, compliance and utilization analytics panels have been enhanced. In addition to showing the compliance or utilization time as a percentage of the current shift, these panels also display the hours, minutes, and seconds spent in compliance or utilization since the beginning of the shift. This time duration appears directly below the percentage value. Average compliance and average utilization panels have also been enhanced.

Group Analytics Dashboard Panels

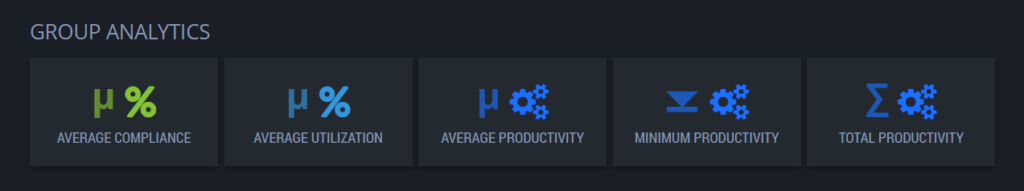
Group Analytics panels show aggregated analytics for all compatible measurements in a selected hardware group or a measurement group.

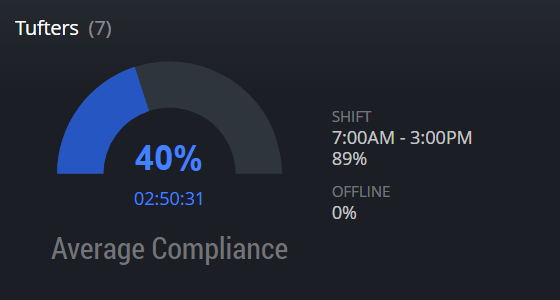
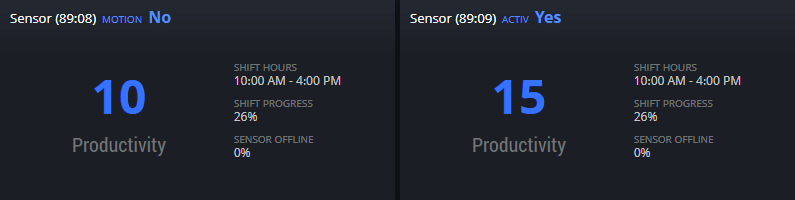
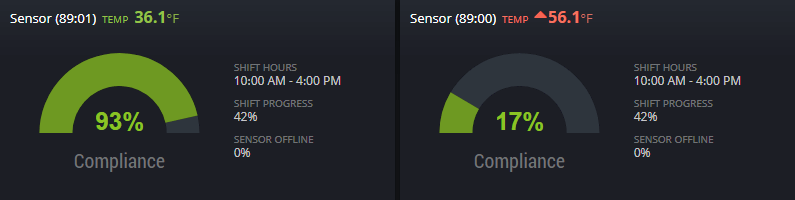
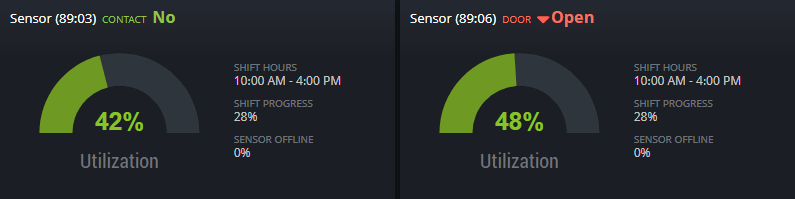
Analytics are aggregated using one of several aggregation functions.  Average Compliance, Average Utilization, and Average Productivity can help determine the overall quality of operations at a facility.  Minimum Productivity is best for assembly lines where production is executed in series.  Total Productivity is best for factory floors where production is executed in parallel.

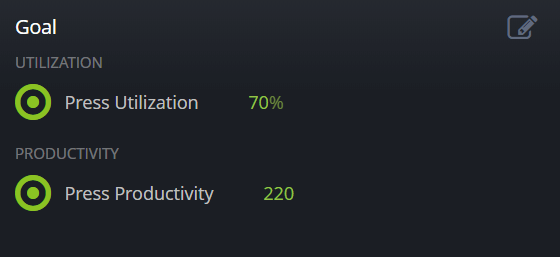
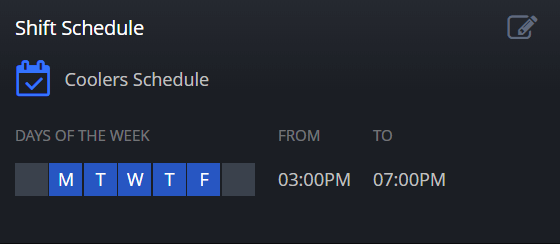
Only compatible measurements are considered in each panel, since compliance requires scalar measurements, while utilization and productivity require binary measurements.  All compatible measurements in the group should share a time zone and have a threshold (threshold is not needed on productivity panels).  If all compatible measurements have a goal, the aggregation function is also applied to the goal, and the panel changes color between green and red based on whether or not the goal is projected to be met by the end of the shift.

Productivity Dashboard Panel

Under the Analytics section, the dashboard supports a Productivity panel. The productivity panel can be used to measure real-time productivity on a production line using measurements that output binary values, such as activity, motion or door. An assigned shift schedule defines the work shifts during which productivity is measured. The productivity counter shown in the panel is based on how many times the binary measurement completed a cycle since the beginning of the active shift.

Compliance Dashboard Panel

Under the Analytics section, the dashboard supports a Compliance panel. The compliance panel can be used to monitor real-time compliance with environmental thresholds using measurements that output scalar values, such as temperature. An assigned threshold defines when a measurement is in compliance according to the threshold’s normal status. An assigned shift schedule defines the work shifts during which compliance is required. The compliance percentage shown in the panel is based on time spent in normal threshold status since the beginning of the active shift.

Utilization Dashboard Panel

Under a new Analytics section, the dashboard supports a Utilization panel. The utilization panel can be used to monitor real-time utilization of equipment using measurements that output binary values, such as activity, motion, door, or contact. An assigned threshold defines when equipment is in use according to the threshold’s normal status. An assigned shift schedule defines the work shifts during which this equipment is supposed to be utilized. The utilization percentage shown in the panel is based on time spent in normal threshold status since the beginning of the active shift.

Learn how Swift Sensors can protect your facility.

Scroll to Top
Talk to Expert